The Console’s Blind Spot
It’s now clear that AI Overviews are affecting SEO performance. However, you can’t see it clearly in Google Search Console, at least not yet. Search Console was built for a ranking-based model of search. It tracks metrics like:
- Queries
- Impressions
- Clicks
- Average position
None of these directly reflects whether your content is used in an AI Overview, cited as a source, or ignored entirely.
Here’s how it breaks down:
| Metric | What it shows | What it doesn’t show |
| Impressions | Your page appeared in search results | Whether it appeared inside an AI Overview |
| Clicks | Users visited your page | Whether AI reduced or replaced those clicks |
| Position | Average ranking | Whether ranking translates into AI visibility |
| CTR | Click efficiency | Whether zero-click behavior increased |
The key issue is that AI Overviews sit on top of this system. Their impact is indirect, and you have to infer it. This creates a pretty big blind spot. You can lose visibility without seeing a clear drop in rankings. Or, you can gain exposure inside AI answers without seeing corresponding clicks.
So the first step is accepting that AI Overview visibility is not a native metric. Then you can move one from there.
Where the Data Still Works (If You Read It Correctly)
Search Console is not useless here. It just requires a different interpretation: you need to read its metrics in the context of reduced and redistributed visibility.
What you can rely on:
- Query-level impressions (shows demand and whether your pages are still being surfaced for specific queries)
- Query-level CTR trends (reveal shifts in user behavior, especially when clicks drop without ranking changes)
- Page-level performance over time (helps identify gradual impact patterns rather than one-off fluctuations)
What you can’t rely on:
- Average position as a proxy for visibility (ranking doesn’t account for AI layers that can push your result out of attention)
- Site-wide CTR as a stable indicator (aggregated CTR hides query-level drops caused by AI Overviews)
- Clicks as a direct measure of exposure (users may get answers without clicking, even if your page is visible)
In other words, you’re no longer tracking performance but diagnosing interference.
Key Signals of AI Overview Impact to Look Into
#1: CTR compression
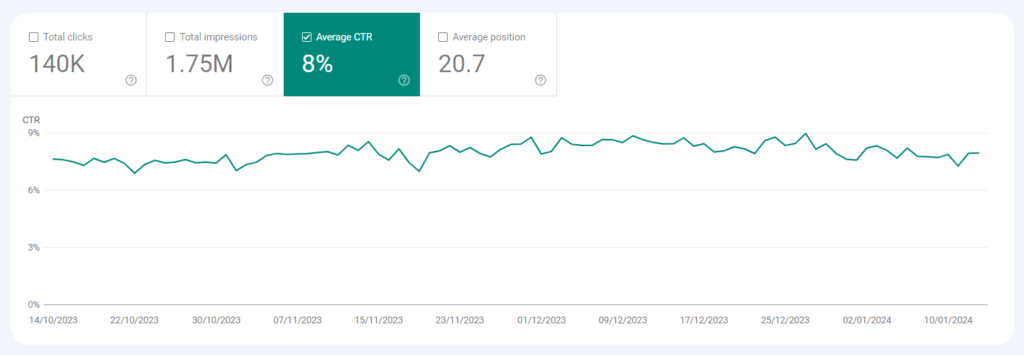
If you’re looking for one metric that consistently reflects AI impact, it’s CTR. What you need to keep in mind, though, is that it doesn’t work in isolation. The pattern to watch looks like this:
- Impressions stay stable (or grow)
- Average position remains unchanged
- CTR declines over time
This pattern suggests your page is still ranking in organic results, but users are engaging with it less than before. Clicks are likely being absorbed by AI Overviews before users reach your URL.
#2: Query segmentation
AI impact varies by query type, so looking at averages masks where visibility is actually being lost. You need to break queries into functional groups.
Segment your queries by intent:
- Definitions and explanations
- Tutorials and processes
- Comparisons and alternatives
- Commercial and transactional
Then track each group separately. What you’ll typically see:
- Informational clusters degrade first (AI Overviews fully answer these, reducing the need to click)
- Mixed-intent queries become unstable (AI partially satisfies the query, splitting attention between overview and results)
- Decision-stage queries hold longer (users still need validation, so they continue to click through)
This breakdown shows where AI Overviews are replacing clicks versus where they still rely on organic results.
#3: Page-level divergence
Another useful pattern is divergence between pages targeting similar topics. If two pages target similar intent and have similar rankings but show different CTR trends, something else is influencing visibility.
Often, that something is whether one page aligns better with how AI systems extract and summarize information. This is not visible in Search Console directly, but the divergence exposes it. So keep this in mind.
How to Build a Tracking Layer
If you want control, you need to extend beyond Google Search Console but still use it as your core dataset.
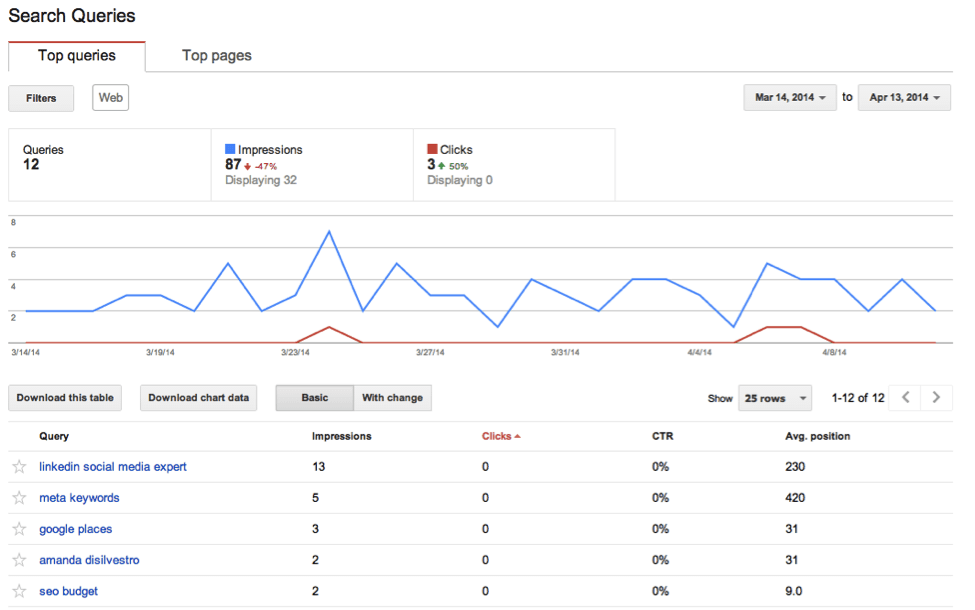
Step 1. Build your query set from GSC
Go to Performance → Search results → Queries and extract:
- Queries with high impressions
- Queries with stable rankings (top 1–5)
- Queries with declining CTR
These are the ones most likely affected by AI Overviews.
Step 2. Validate AI presence against those queries
Take that same query list and check:
- Does an AI Overview appear for this query?
- Is your domain cited?
- Which competitors are consistently included instead?
At this point, you’re validating GSC signals against real SERP behavior.
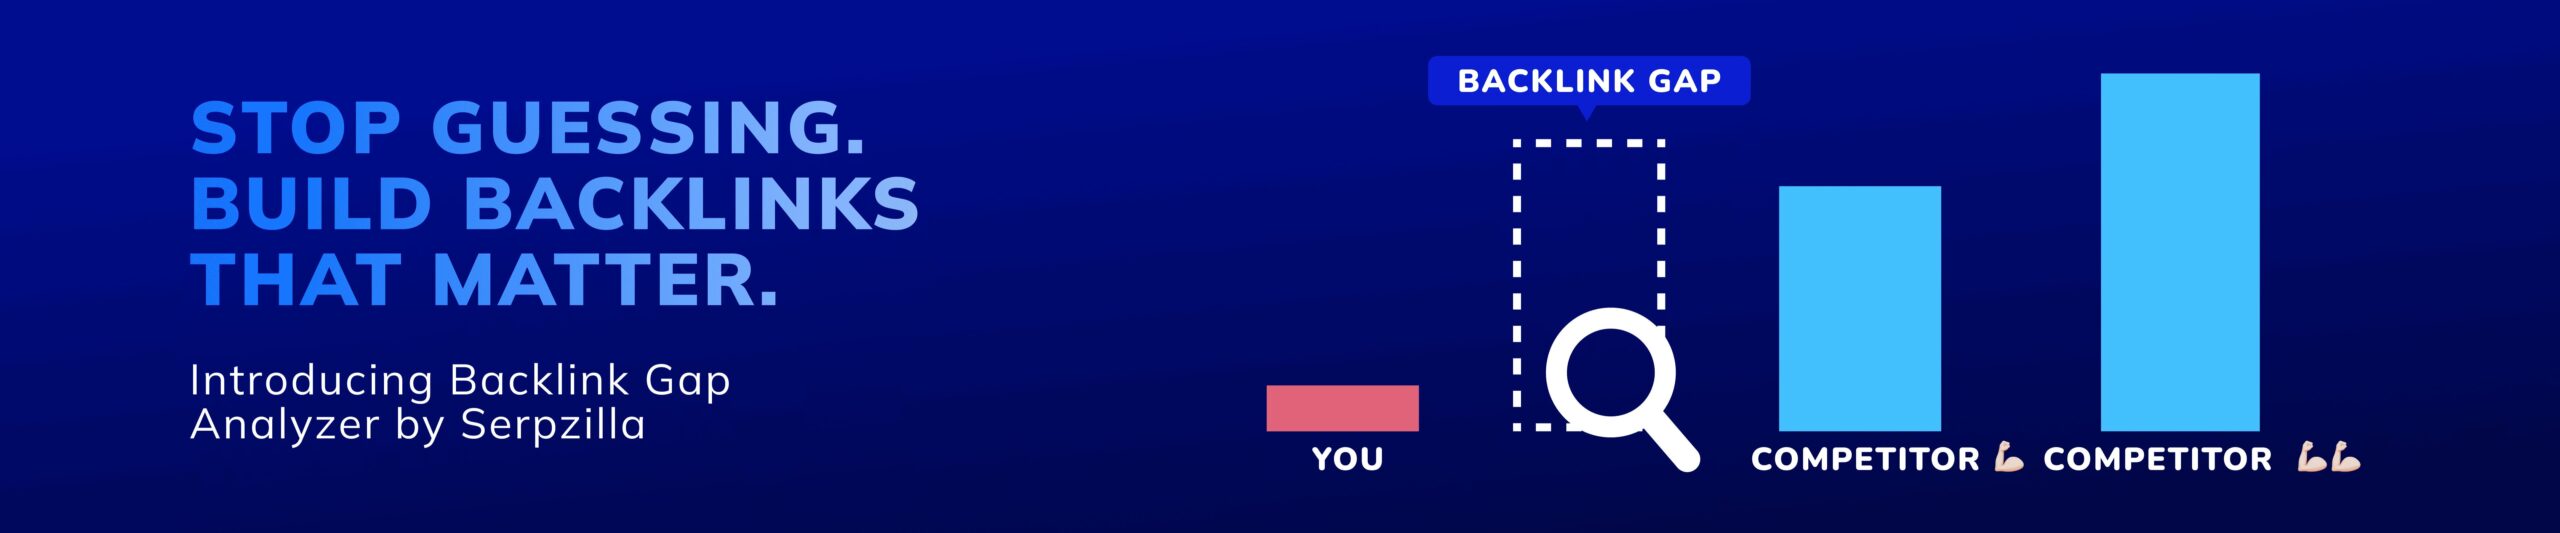
Pro tip: If you notice the same competitor domains appearing in AI Overviews, it’s worth analyzing their link profiles. Use Serpzilla’s Backlink Gap Analyzer to see whether those competitors have structural advantages (like stronger high-authority segments) that might be influencing their inclusion.
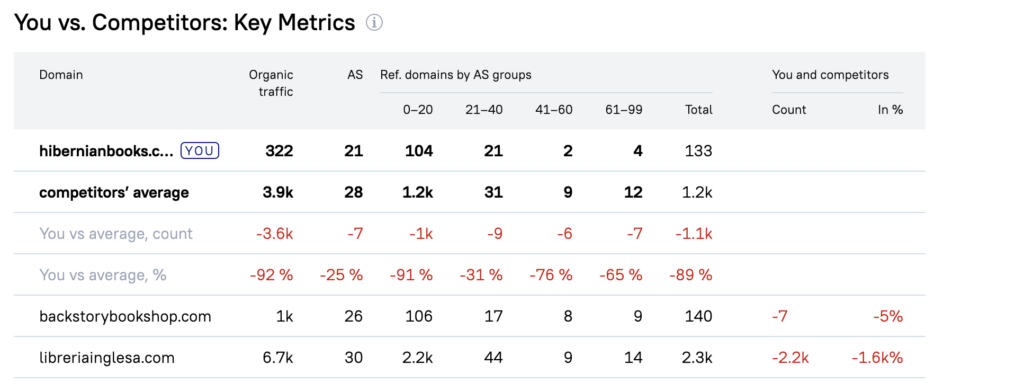
Once you identify the gap, filter placements in Serpzilla by those exact parameters (e.g., Authority Score range, niche, traffic) and build links specifically in that segment until your profile matches theirs.
Step 3. Map AI presence to GSC metrics
For each query, compare:
- CTR trend. Is it declining?
- Position. Is it stable?
- Impressions. Are they holding or growing?
Then interpret what you see. The logic is pretty transparent:
- Stable position + falling CTR → AI is absorbing clicks
- Stable metrics → low or no AI impact
- Volatility → mixed AI + organic competition
This approach gives you a working model grounded in actual data.