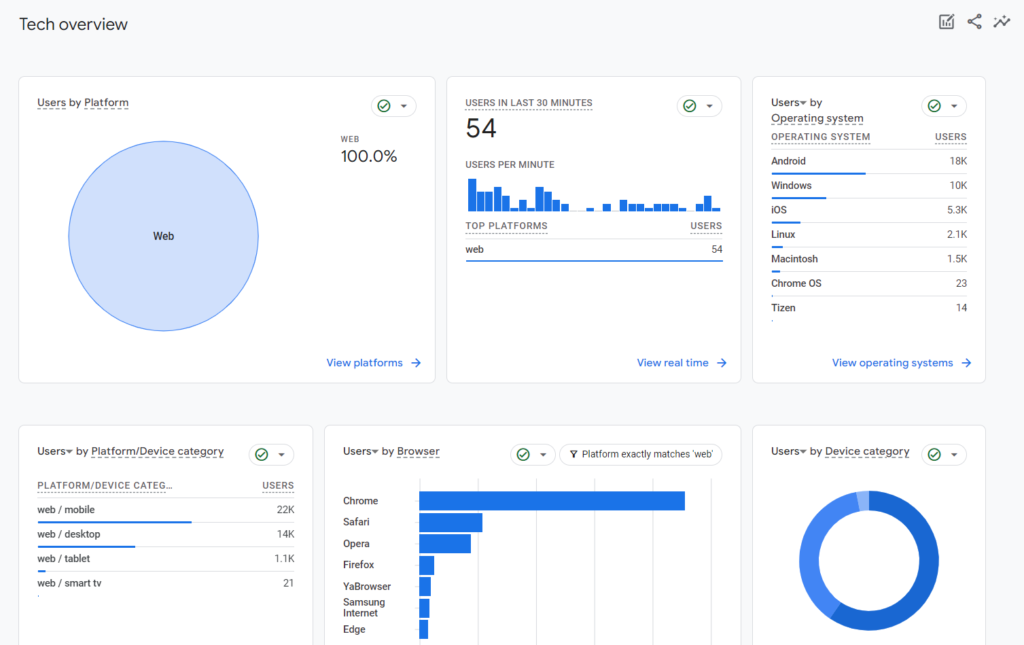
Google Analytics is necessary for analyzing visits to your site when promoting it in Google. It’s crucial to understand how to configure and use its functionality correctly.
Note that as of July 2023, Universal Analytics (GA) will cease to work. This service will be replaced by Google Analytics 4, which will aggregate information without cookies and sessions, using user identifiers and events.
Step 1: Register in the Service
If you are not registered, click “Create Account” on the page https://analytics.google.com/analytics/web/ and follow the instructions.
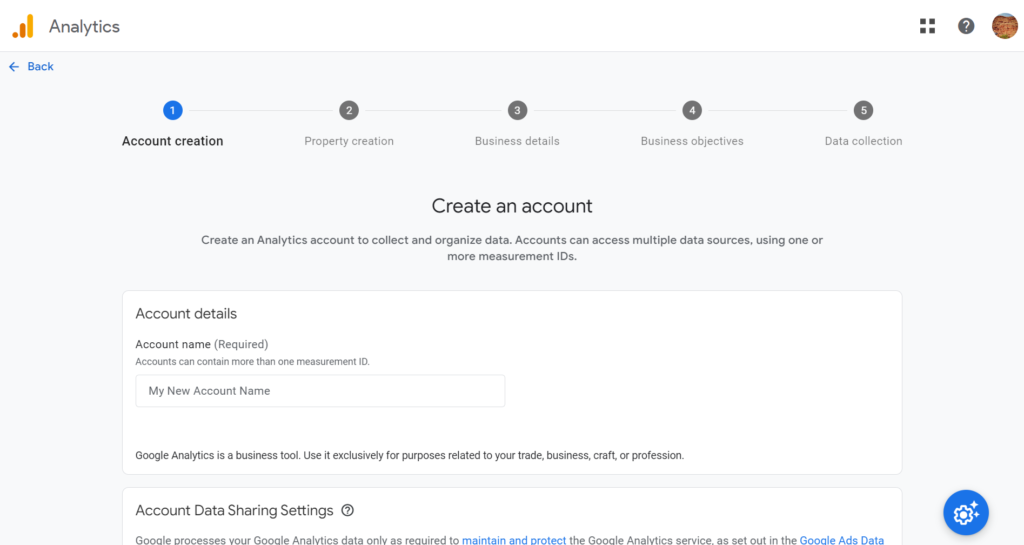
To continue the process, do not change the data access settings. Click “Get Tracking ID.” Then select your country and agree to the privacy policy.
Step 2: Connect Your Site
The easiest way to connect analytics is through Google Tag Manager. Create an account on the service page (https://tagmanager.google.com/?hl=ru#/admin/accounts/create), enter your site’s URL, and select “Web” as the platform.
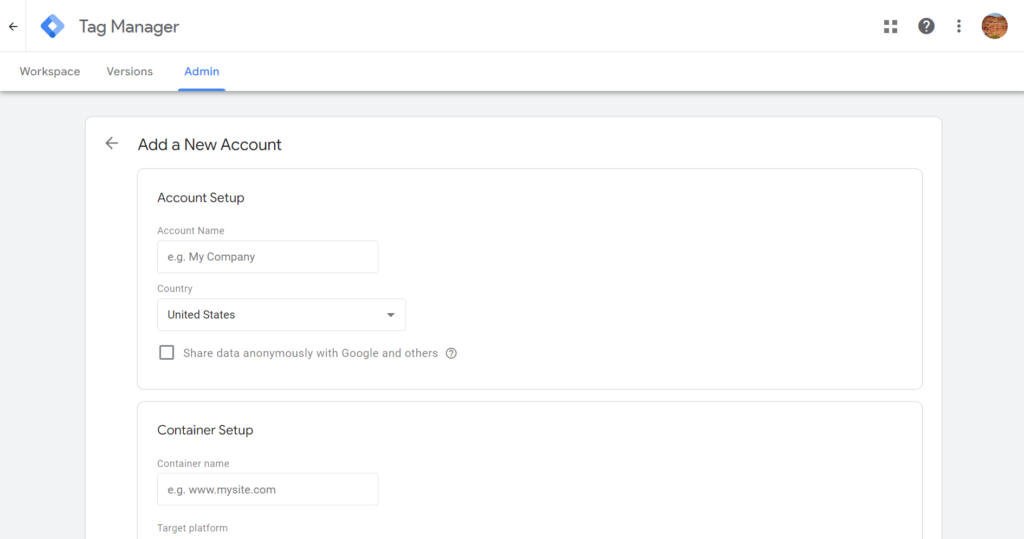
After clicking “Create,” you will receive a code to install on your site following the provided instructions. If you are not confident in doing this yourself, it is better to entrust this task to a developer.
Next, create a tag to monitor visits and connect “Analytics” to your GTM container. Follow these steps in your Google Tag Manager account:
- Go to Tags > New > Tag Configuration > Google Analytics.
- Check the box “Enable overriding settings in this tag” and enter the site identifier you received in Google Analytics in the field that appears.
- Select the “All Pages” trigger.
- Save this tag, then click the “Submit” and “Publish” buttons located in the upper right corner of the page.
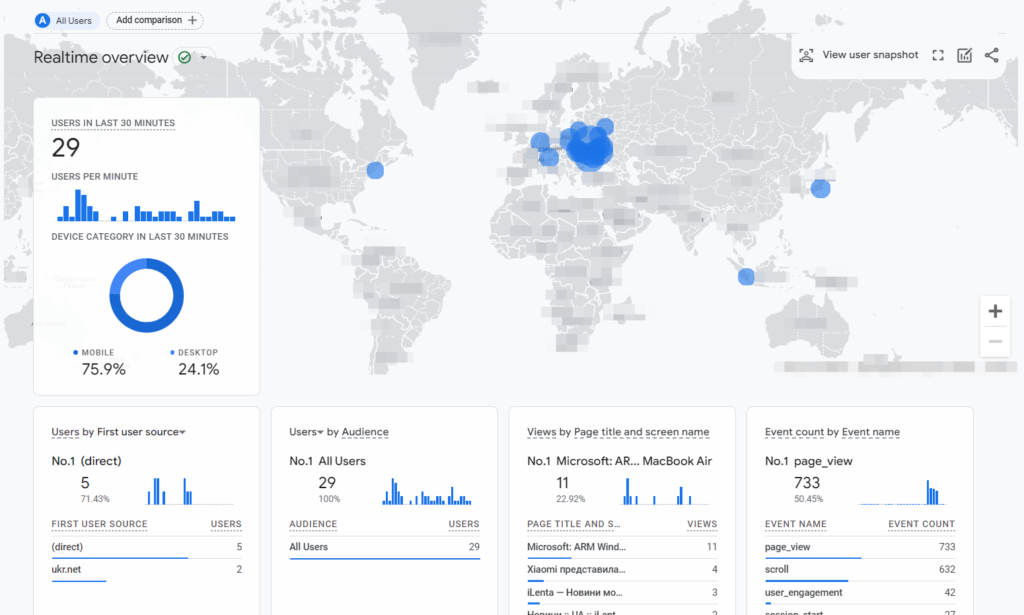
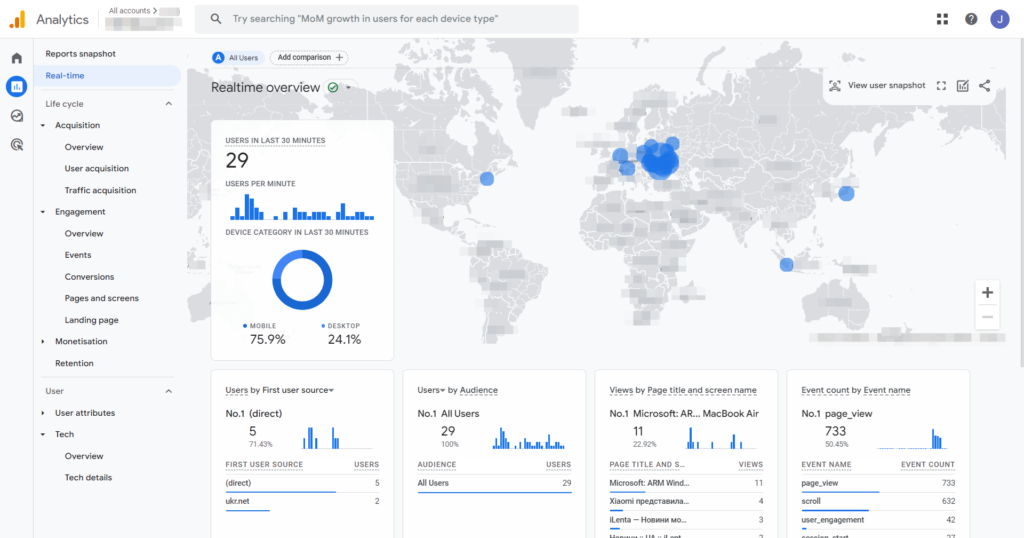
To ensure correct operation, open your site, go to the Google Analytics dashboard, and open the “Reports” tab. Then check the “Real-Time Report” – if data from your site appears there, everything is working correctly.
Step 3: Goals
Specify which customer actions you want to track using the service. These can be clicks on buttons, purchases, or other actions. Set the appropriate goal using GTM.
For example, to track clicks, you need to enable a variable and also add the corresponding tag: go to the “Variables” menu > Configure > Clicks > and select “Click Element”.
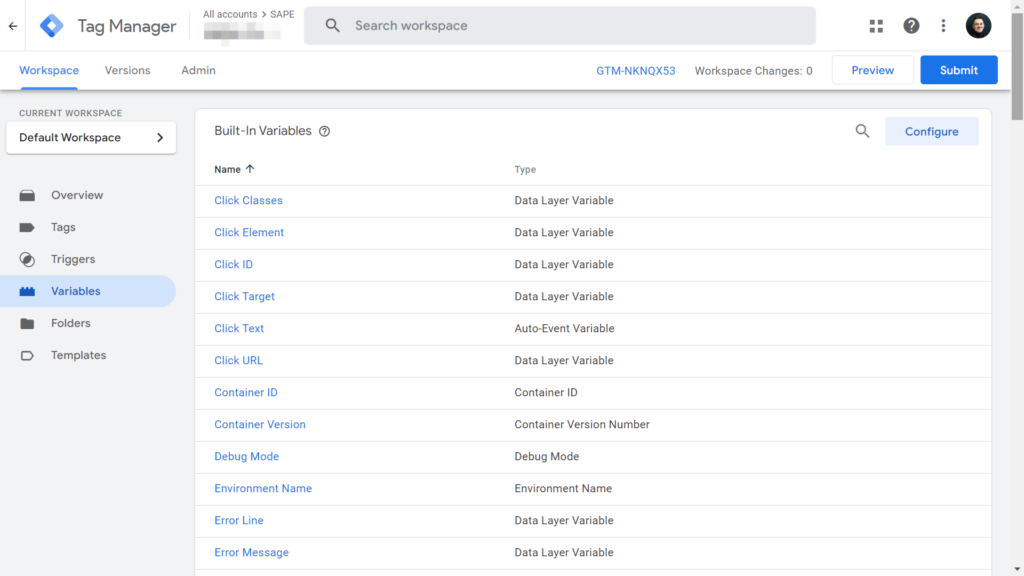
Specify a trigger for the tag to fire and copy the code selector. Save the tag and add the goal to the analytics system, selecting the type “Event” in your Google Analytics account: Go to the “Admin” tab > View Settings > Goals.
After this, you can monitor traffic sources and user actions. For this purpose, we recommend paying special attention to the “Traffic Sources” report.
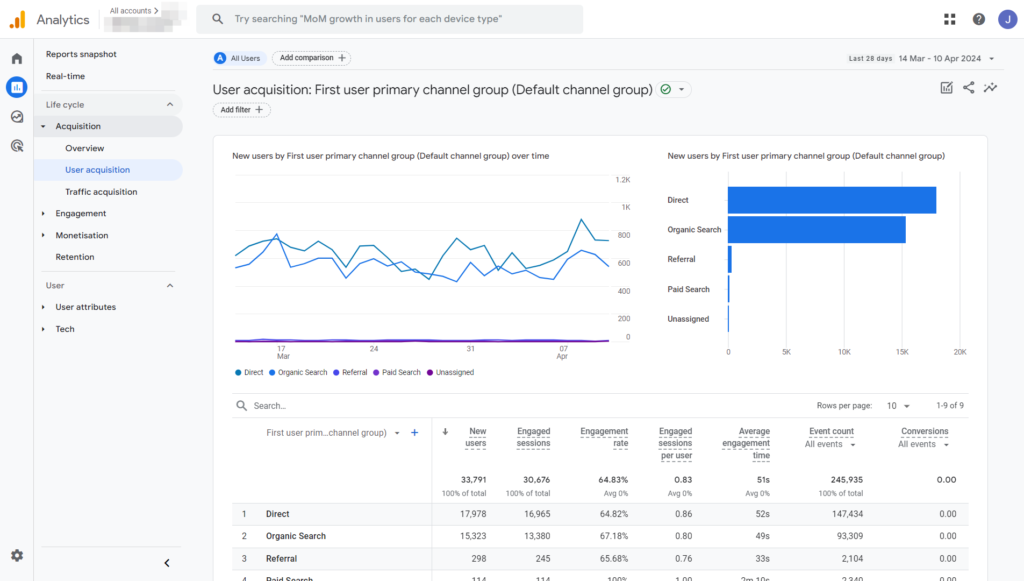
Basic GA4 reports
Real-Time Report: A basic tool for assessing the current state of the site. This real-time report shows what users are doing on the pages of the resource right now.
Traffic Sources: This report is essential for analyzing where users come from to your site. It helps identify which sources (search engines, social networks, advertising campaigns, direct traffic, etc.) attract the most visitors and which channels lead to more conversions. Within each source, you can see metrics like the number of sessions, session duration, bounce rates, conversions, and others. Using this report allows you to identify the most effective traffic sources and focus on them, as well as to spot problematic channels and optimize them.
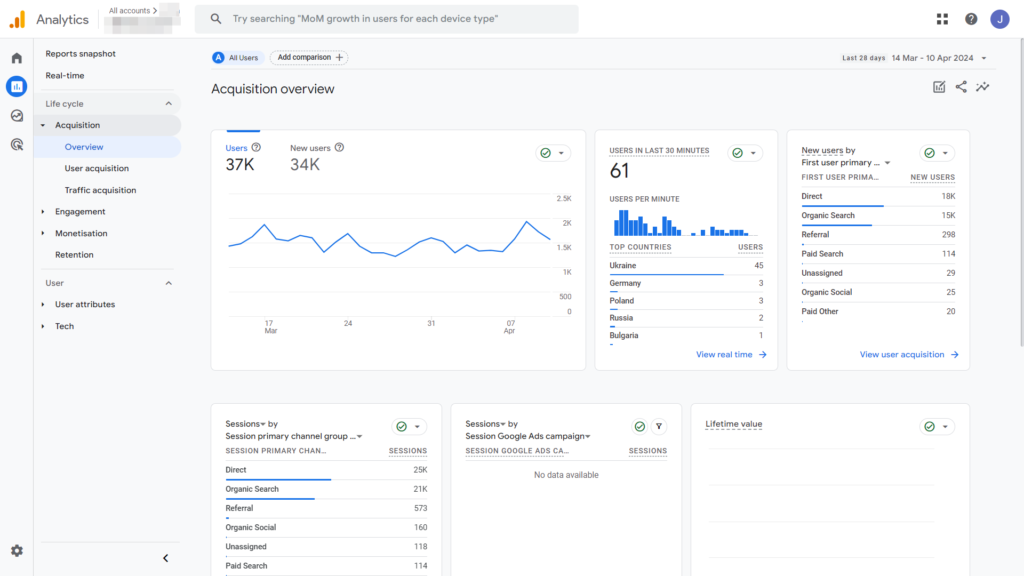
Engagement: Detailed information about user behavior. Here, you can see metrics like screen views, scrolling, unfolding of product cards, etc. This report is used to analyze user behavior on the site and understand how they interact with your content. It provides information about how much time they spend on pages, what actions they take, what events occur on the pages, etc.
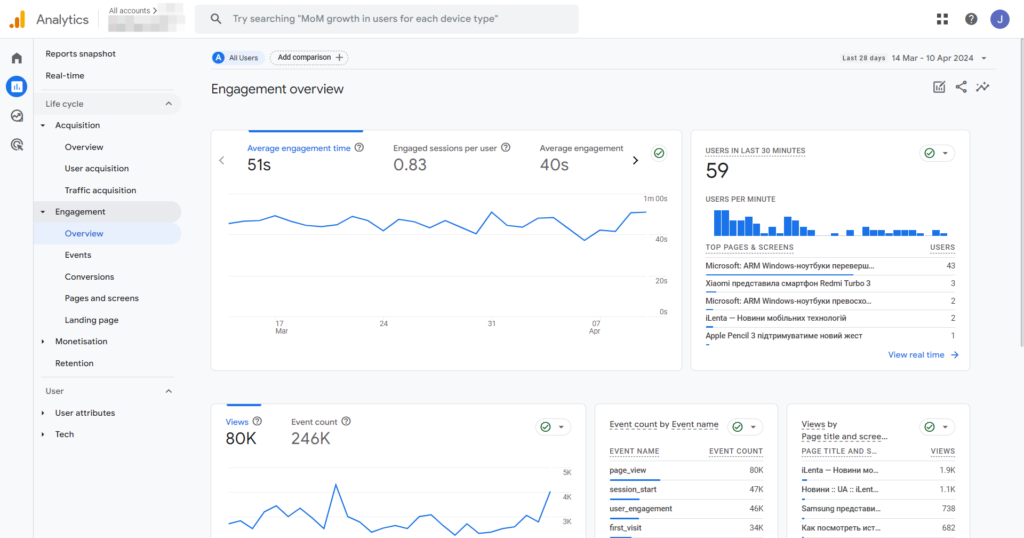
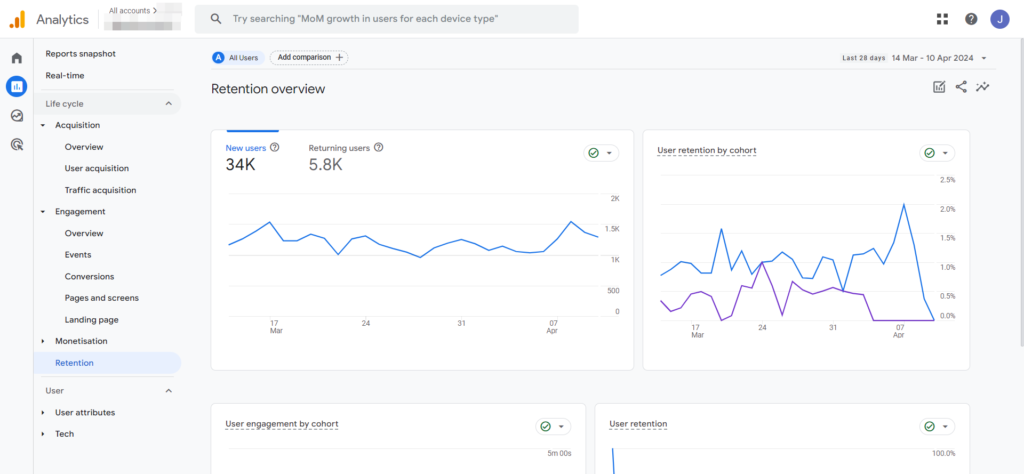
Retention: An interesting report that shows how users interact with the site after their first visit. This is especially valuable for online stores and other commercial resources where users are likely to explore several offers and then return to the site with the best option.
Technology: Provides information about the devices and technologies your users use to access your site or application. The report allows you to see what percentage of users use computers, smartphones, tablets, or other devices to access your site. It also shows which browsers, operating systems, screen resolutions, and other technologies your users use.
