Google Search Console (GSC) is a convenient, free tool that provides information about a site’s effectiveness in search engine results. It allows you to track a significant amount of data necessary for SEO, making it indispensable for promoting sites in Google.
The main purpose of this online service is to monitor a site’s performance and its functionality from the search engine’s perspective. It contains a range of metrics related to search optimization and user experience. SEO specialists from all over the world have repeatedly noted that it’s through GSC that an SEO-specialist can effectively improve a site and gain more traffic.
Additionally, through the console, the search engine can transmit signals about security problems or suspicions of manipulative actions. The main functions of the service include:
- Monitoring indexing and the work of search bots,
- Detecting and correcting errors,
- Analyzing search effectiveness,
- Requesting page indexing,
- Analyzing external and internal links.
However, using the console is not a ranking factor for a site in search results — it does not improve your positions by itself. But Google Search Console can significantly enhance the effectiveness of optimization.
Getting Started with the Console
First, you need to verify that you are the owner of the site. This can be done in several ways, depending on whether you are verifying ownership of a website, domain, or a Blogger-based site.
You can use the following methods:
- Uploading an HTML file.
- Meta tag.
- Google Analytics tracking code.
- Google Tag Manager.
Note that some hosting services do not allow certain methods from this list. Standard methods are uploading an HTML file and using a meta tag. These verification options work in a mode that uses URL prefixes.
Uploading an HTML File
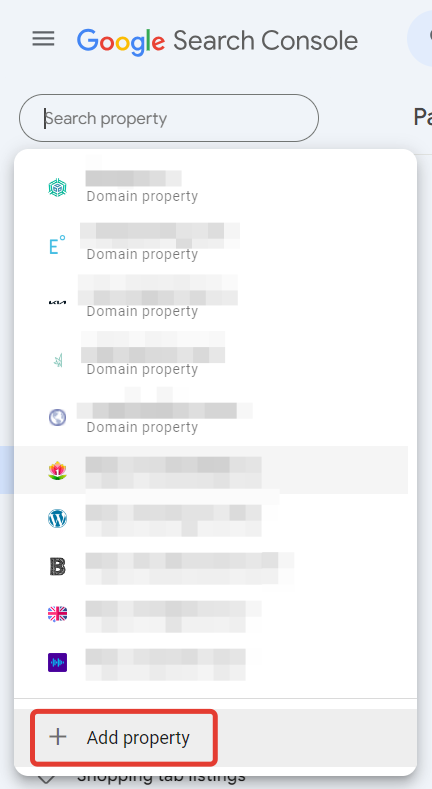
- Go to the console and open the “Resource” line in the upper left corner.
- Enter the URL of the site and click “Add Resource”.
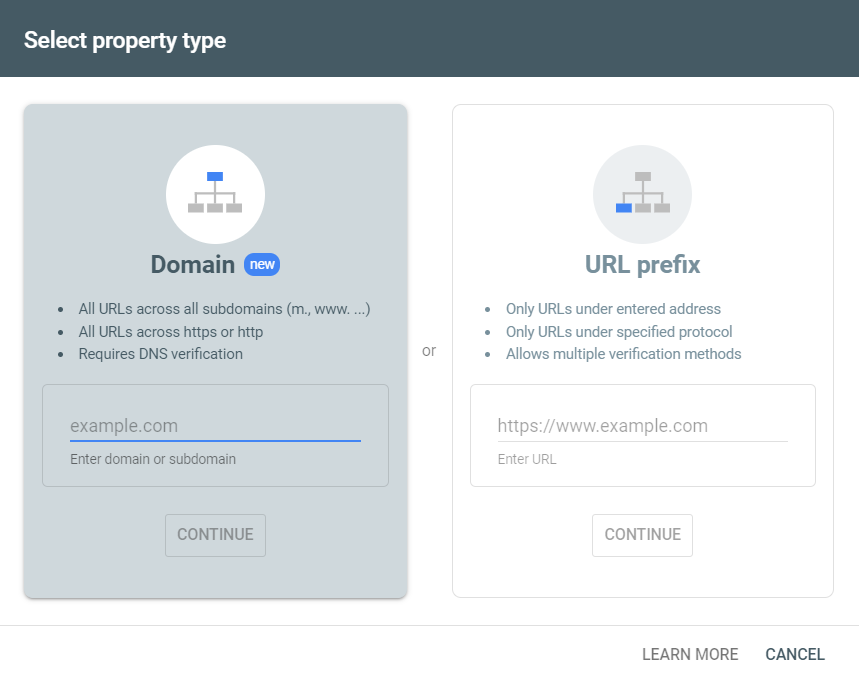
In the pop-up window “Select Resource Type,” specify your site’s URL and click “Continue.”
Download an HTML file. Then place it in the root directory of your website. For example, if the root directory is https://website.com, and the file is named file.html, its final location will be https://website.com/file.html.
Complete the verification process. For websites built on Wix, you will also need to add a meta tag with a description.
Searching and Correcting Errors with GSC
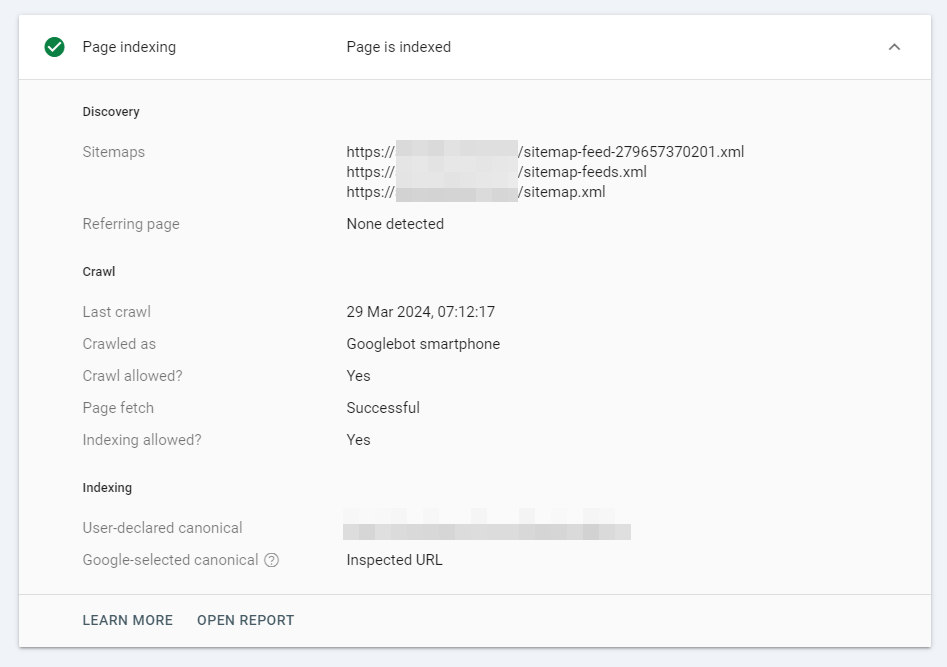
Often, the success of a website’s search optimization is undermined because Google cannot index pages correctly. Various errors usually hinder search bots’ work. You can search and correct them through the console using the “URL Inspection” tool.
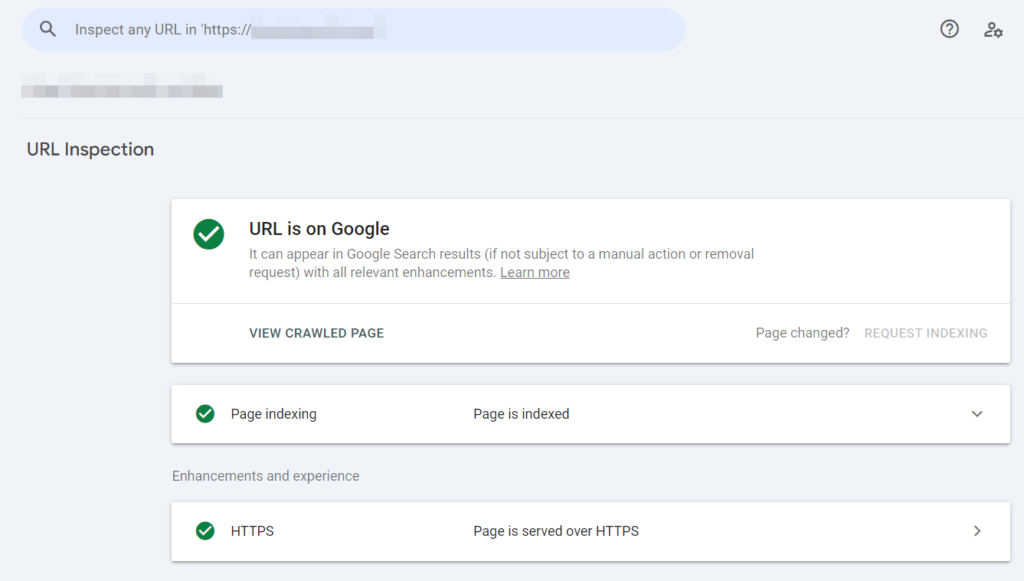
With it, you can check whether a given URL has been indexed and whether it appears in search results. After specifying the URL, users can:
- Request indexing of an updated page,
- See how the search engine discovered the page (via a sitemap or from other pages),
- Find out the date of the last visit by search robots,
- Check if Google uses the canonical URL or redirects to the site differently,
- Know the usability status for mobile devices,
- Check the functioning of breadcrumbs and other features.
Site Search Effectiveness Report
The Performance report shows how the site performs in search results.
This report inspects four types of search: web, images, video, and news. By default, web is always selected, but you can change this type in the settings. To understand the effectiveness of the results, compare the indicators of different types.
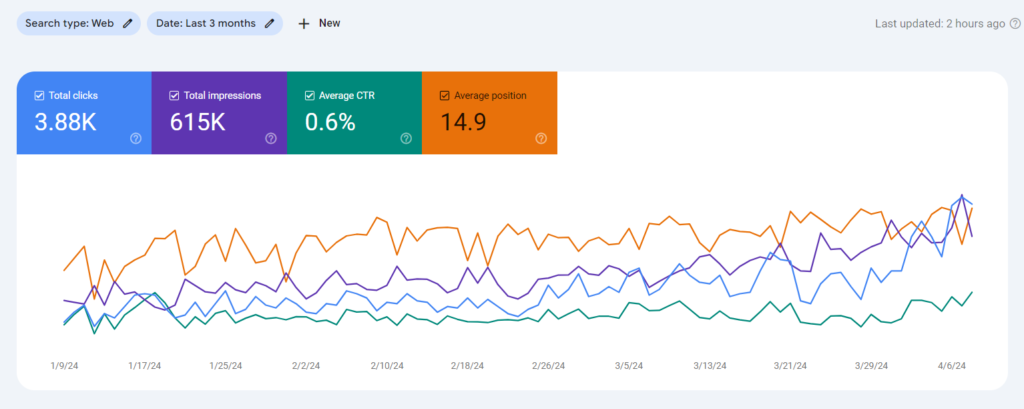
At the top of the report are four different metrics:
- Total number of clicks,
- Total number of impressions,
- Average CTR,
- Average position.
Search Results
By default, the first two metrics are displayed. By clicking on the tables dedicated to each metric, you can display their content on the main screen.
Impressions
Impressions are the number of times your site appeared in search results. If a user did not click on a link to see the URL, it is considered an impression. Even if the URL was displayed at the bottom of the page and the user did not scroll to that level, an impression is still counted.
A high level of impressions is good, as it signifies that your site frequently appears in search results. However, its full value can only be understood after comparing it with Clicks and Average Position.
Clicks
This metric shows how often users click on a link to your website in search results. A high number of clicks in addition to a large number of impressions is a good sign.
A low number of clicks with a high number of impressions suggests that you need to work on improving traffic. Clicks are more indicative in terms of quality assessment than Average CTR and Average Position.
Average CTR
CTR is the ratio of clicks to impressions. A low CTR indicates the need to increase organic search visits. The higher the CTR, the better.
This metric works well in conjunction with Average Position.
Average Position
This parameter shows the average position of your site in search results. If it is 1-10, that is a very good indicator. If it is 20-29, it means that the site typically appears on the 2nd or 3rd page of organic search results – this is also good and should be promoted higher.
A value of more than 30 indicates that the site needs quality promotion, but it can also show that for some key queries the site ranks very high, while for most it is low. In any case, it is worth focusing on improving content, internal optimization, or link promotion.
In general, all four metrics together give a good overall picture of the site’s presence in search results.
Performance Indicator
Next, the report shows the site’s effectiveness in search results. Data can be filtered by the following indicators:
- Queries – top search queries, the number of clicks, and impressions of your site for them.
- Pages – the most top pages of your site, as well as their clicks and impressions.
- Countries – regions with the highest visitation of your site.
- Devices – devices from which your site is most often viewed.
- Search Appearance – shows the types of results in which your site appears in search results.
- Dates – a table indicating clicks and impressions by dates.
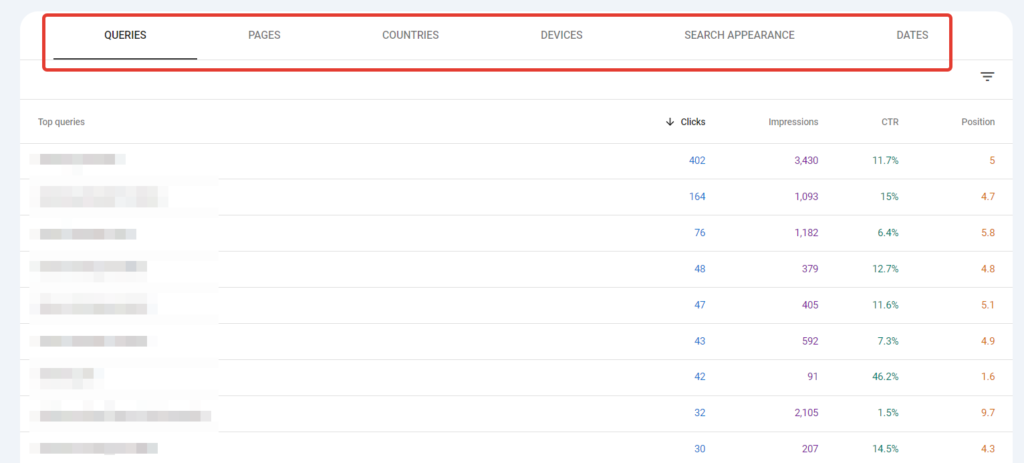
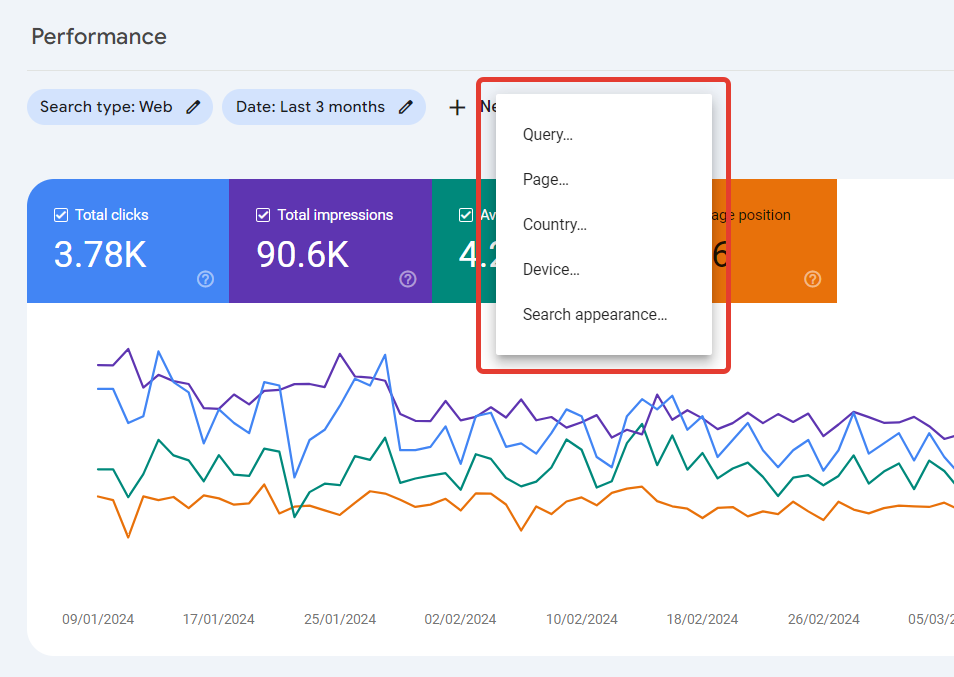
It’s important for SEO-specialists to know how and from where users come to their site. For example, to track which queries generate the most traffic. This can be done in the “Queries” section.
Low-frequency queries are of the most interest. Some of them provide little traffic, while others may be worth creating separate pages for promotion. By promoting the site for some of these queries, you can achieve significant traffic growth.
Page Indexing
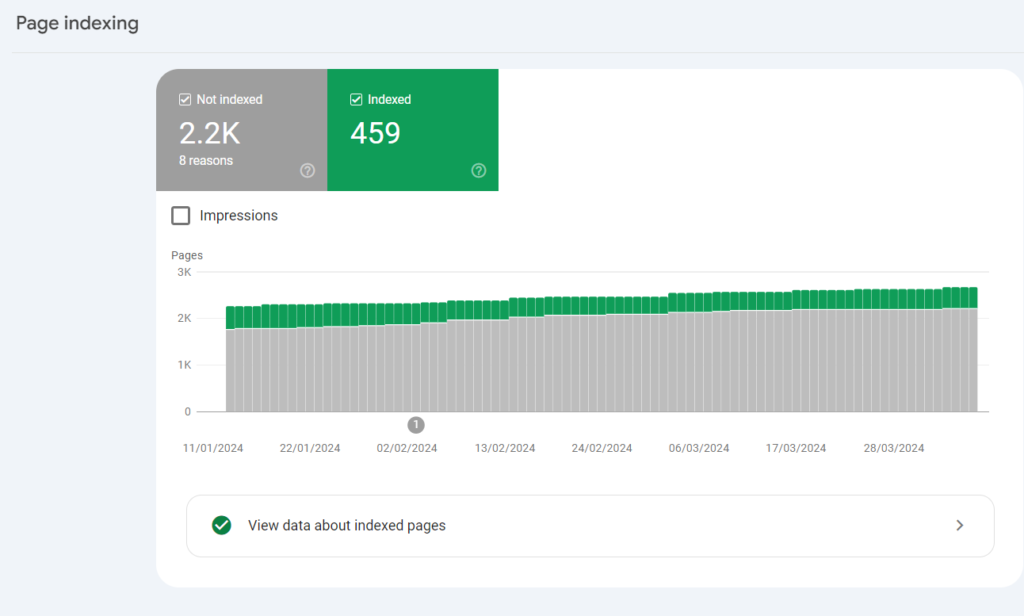
Using GSC, an SEO-specialist can learn how the pages of his site are indexed.
Page indexing
The Coverage section shows how Google found the URL, whether bots successfully analyze the site (if not, it explains why), and also displays the status of structured information.
Error Reports in Pages
Although these reports are called errors, they do not always mean that the site is malfunctioning. Sometimes they show that site indexing can be improved.
For example, a 403 error means that the server prohibits Google bots from analyzing the URL. For instance, on large forums, the server might prohibit them from viewing user pages. The GSC report will list all pages that are closed to bots. By clicking on any of the listed URLs, you will see a menu with an inspection option. By selecting this option, you will learn how Google discovered this page. Additionally, you will find out:
- The date of the last visit by search robots,
- Whether the page view was allowed,
- Whether the view was allowed,
- The error code, if there was one,
- Whether indexing of this page is allowed.
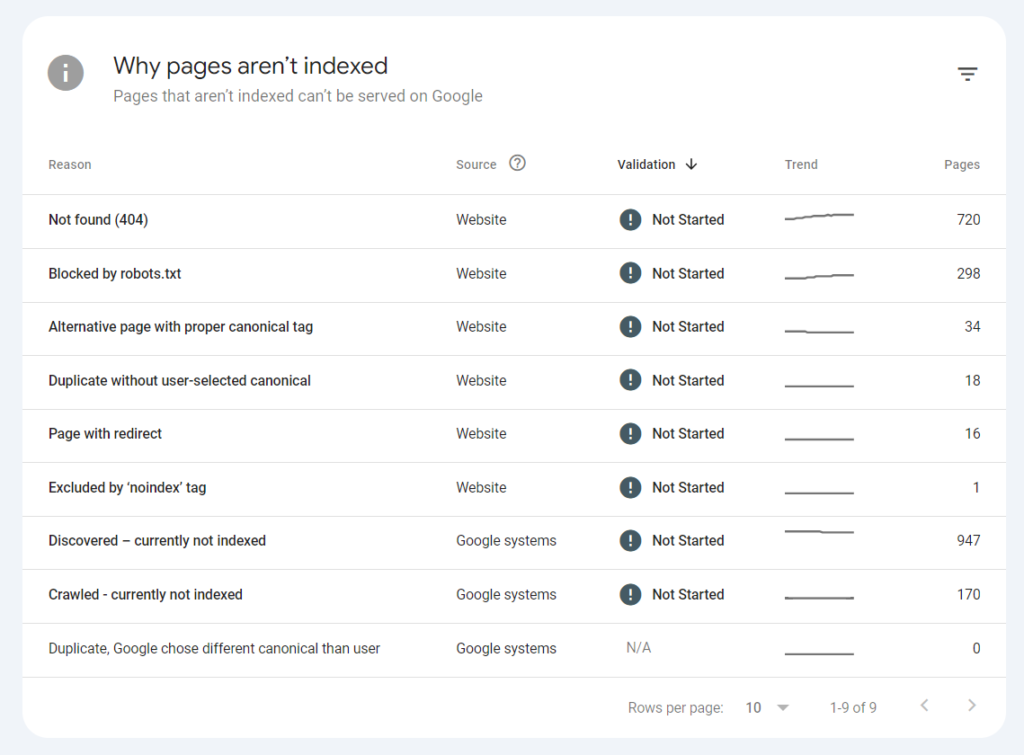
The Coverage Report also warns of 404 and 500-series errors. A 404 response is called an error, but technically it is just a report of a transition to a non-existent page.
By clicking on the corresponding URLs, you will find out which pages or sitemaps link to non-existent pages. If the link is broken, you can fix it or set up a redirect to another, correct page. However, if there was an error and such a page never existed, then the 404 error does not need to be fixed.
Sitemap Files
A Sitemap is an XML file that contains a list of URLs and is necessary for search engine navigation on your site. They are especially useful for large resources and those that regularly add new content.
Having a Sitemap increases the likelihood of search bots visiting and subsequently indexing pages. Some plugins and even websites automatically generate this file.
The console offers Sitemap reports and the option to upload a file. To access this feature, click on the menu on the left. The Sitemap Files section contains error messages.
Using the console, you can remove the Sitemap from reports, but in this case, don’t forget to physically delete the file from the site to avoid confusing Google bots.
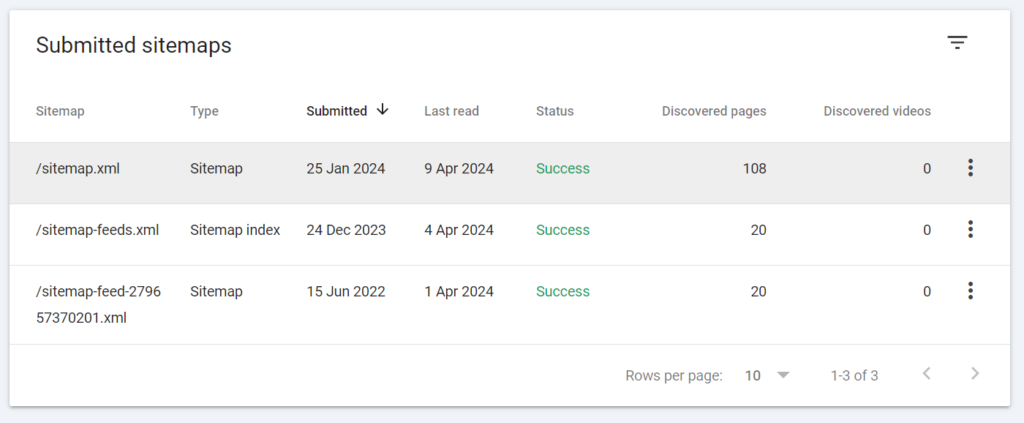
After launching, the Coverage report will start managing the Sitemap section and help resolve issues related to URL indexing.
Removing URLs from Search Results With this tool in Search Console, you can temporarily (for about 6 months) remove a URL, its current page description, or its cached version from Google’s search results.
Quality of User Experience Thanks to GSC, Publishers can monitor the quality of the user experience provided by the site.
Page Usability This report contains data on whether your site is user-friendly. The usability of individual pages affects its position in Google search results.
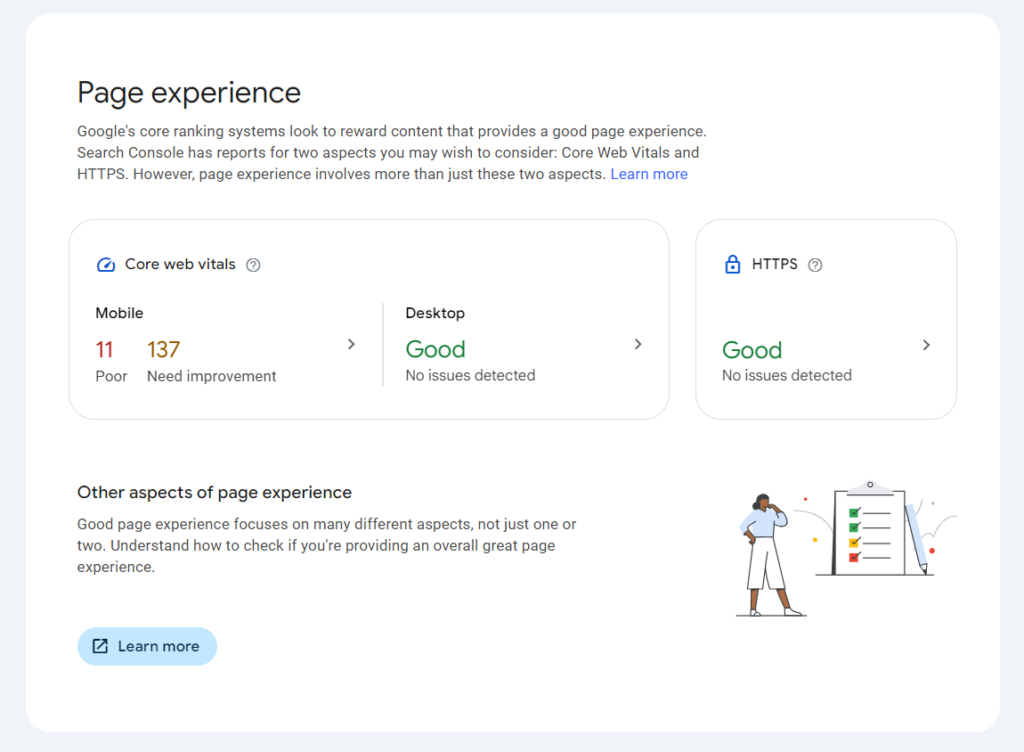
Core Web Vitals This report provides information about the experience visitors receive on your site. It is influenced by the site’s loading speed, mobile device adaptability, and information from Core Web Vitals. These are three indicators that potentially affect the resource’s ranking in Google:
- LCP (Largest Contentful Paint) – the speed of loading the main content on the page.
- FID (First Input Delay) – the time it takes for the first interaction with the content to be possible.
- CLS (Cumulative Layout Shift) – layout stability (how much the layout shifts during content loading).
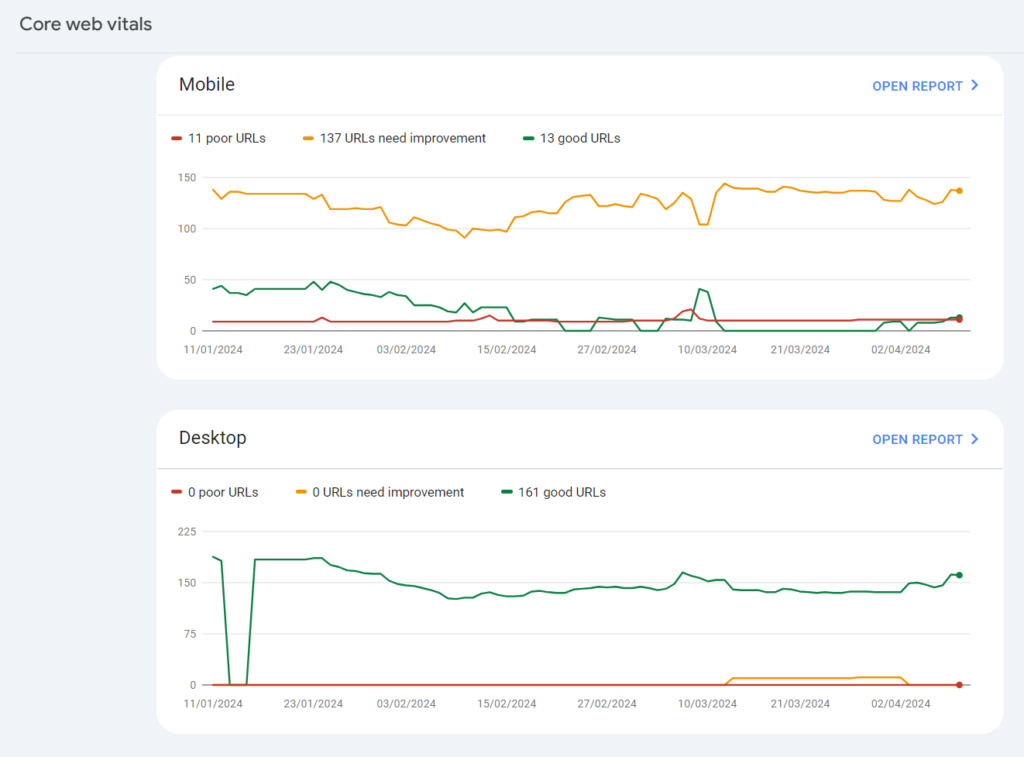
Mobile Usability
The report provides information about which pages of the site are not optimized for mobile traffic.
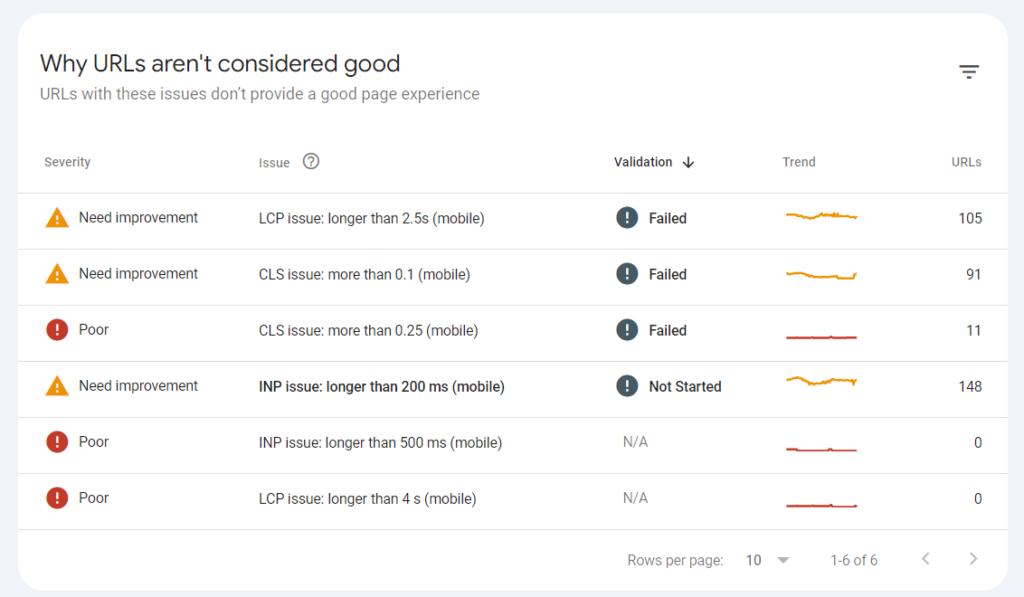
Search Appearance Report This report contains data about “rich results” in search. You can see separate reports for impressions for each type of such results and find out how much traffic they brought to the site, as well as their importance for promotion.
If you notice a sharp decline in values in this report, it’s a reason to rethink and work on your site’s content.
Security Issues and Manual Actions This section of GSC contains two more useful reports.
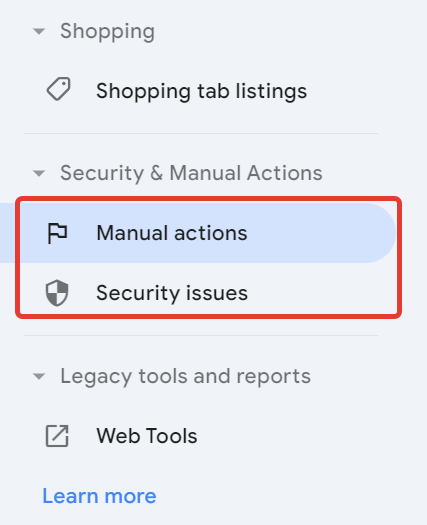
The “Manual Actions” report contains information about penalties imposed by Google employees.
The “Security Issues” report contains information about harmful content on the site’s pages: viruses and other unwanted software, programs that mislead users, etc.
Links The console also lists all the links leading to the site. However, from this report, you won’t know which of them help rank the site and which do not.
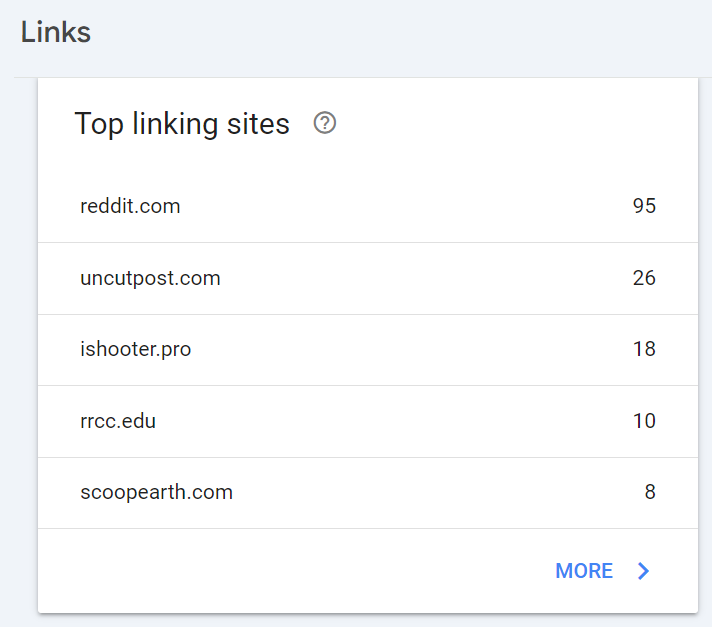
The Links tab has two columns: Internal and External.
The External section contains three link reports:
- Top pages.
- Top sites.
- Top text.
External links greatly help with search promotion, especially in Google. Properly building a diverse link profile and selecting link donors are the focus of research by the Serpzilla team.
The Internal Links report only displays pages.
You can click on each report to get expanded detailed information. However, if it’s about external links, you’ll only learn about the domain that links to you, not the specific page.
This report allows you to determine which page has received the most external links and identify pages where you should increase link mass. Using internal linking and working on the anchor list based on this information, you can also increase the weight of landing pages.
Console as an SEO Tool
In addition to the above functions, the console can also upload link disavowal reports, site security reports, and has several other useful features.
The sooner and more fully you master all the capabilities offered by this tool, the more effectively you can promote your site.


