Who is this article for?
- Media planners who need to build or modify their advertisement strategies.
- SEO specialists who need arguments to defend their SEO strategies in front of the client.
- Business owners and marketers who need to analyze an SEO contractor’s results and credibility.
In June 2022, the Serpzilla team performed a large-scale study on the search engine rankings of online stores in the niche of electronics.
Electronics is one of the most rapidly evolving and highly innovative industries. This segment takes a huge chunk of the eCommerce sector and hence is rife with competition and, sadly, fraudulent resources. As a result, marketers must invest heavily in SEO to build trust and brand visibility. They need to ensure buyers get a sense of familiarity and safety.
A strong online presence in this domain allows electronics marketers to build trust with their audience and boost their customer lifetime value (LTV).
The electronics niche we studied comprises products such as smartphones, laptops, tablets, various digital gadgets, etc.
The purpose of our research is to support marketers and SEO experts in their endeavor to improve their online visibility and ranking. The findings from this study will benefit digital marketing enthusiasts and SEOs alike, forming a framework for future studies in the field of SEO and digital strategy.
Let’s uncover the insights and findings.
How we collected semantics and keyword volume
Semantics or a semantic core signifies the list of keywords that the target audience enters into the search engine while looking for a product or service. Collecting and “cleaning up” the semantic core was the most time-consuming step on which all further research work was based.
We have collected all non-brand keywords which can get you organic traffic in the electronics niche:
- We took the top 10 sections in the eCommerce Electronics niche of popular marketplaces and relevant online stores.
- Exported keywords by which they are ranked.
- Expanded CL by collecting similar search queries through Google Keyword Planner, Ahrefs, Serpzilla database and tools, and search suggestions.
- Received about 1 million keywords.
- Cleaned up the semantic core from branded keywords via stop-word masks.
- Removed all keywords with a volume below 10.
- Clustered the keywords and did some “manual cleaning”.
- The output was a clean list of 230K keywords.
Reference material
Let’s clarify some of the terms and their meaning so that we can accurately interpret the study in the same way.
1.Keyword Difficulty (KD) – an estimate of how hard it is to rank in the top 10 organic search results for a keyword on a 100-point scale.
- 1-10 — easy (less than 10 Ref domains)
- 11-30 — medium (11-36 Ref domains)
- 31-70 — difficult (37-200)
- 71-100 — very difficult (200+)
We use a simple method for calculating KD. We pull the top 10 SERPs for your keyword and evaluate the number of referring links to each of them. To collect the backlinks we use different tools: Ahrefs, Serpzilla and SemRush. The more backlinks the top-ranking pages for your keyword have the higher its KD score. Very simple and very actionable.
https://ahrefs.com/blog/keyword-difficulty/
2. Volume — an estimated number of the average monthly searches for a keyword based on the latest known 12 months of data.
3. Global Search Volume — the average monthly number of times people search for the target keyword across all countries.
4. Traffic Potential — This depicts the sum of organic traffic that the #1 ranking page for the target keyword receives from all the keywords it ranks for.
5. CPC — Cost Per Click shows the average price that advertisers need to pay for each ad click in paid search results for a keyword.
Relationship between keyword volume and difficulty
The keyword volume is collected on a broad match, as given by Google Ads.
We cut off all keywords with volume <10 and got 230,856 keywords out of the 421,189 originally collected. We divided them into various groups by volume.
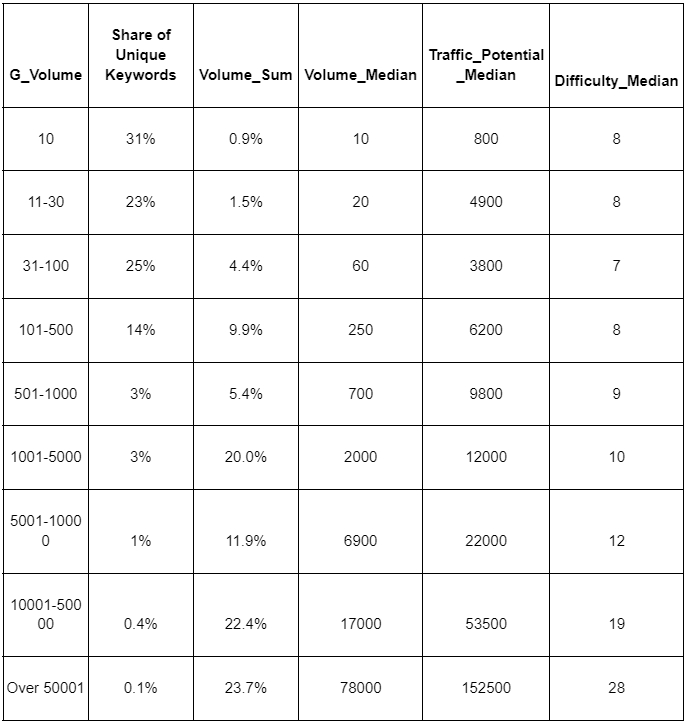
As you can see below, in the first section, there’s already a clear correlation between Volume and Keyword Difficulty:

This becomes even more obvious once presented in the graph:
A closer look at the Volume/KD correlation
There is a definite correlation between Keyword Volume and Keyword Difficulty, meaning there is also a correlation between the Volume and the number of referral links. In other words, the more popular the keyword, the more links you need to promote it.
Keyword volume
There is an inverse correlation between volume and the number of keywords in each segment. The number of unique keywords decreases as the volume rises and vice versa (see graph below).
We also found that there is a massive number of keywords with a difficulty of 10. This means the estimated promotion difficulty is low, since you need fewer links to get these keywords out.
As seen in the graph below, the total volume for all keywords with KD 10 is about 30 million:
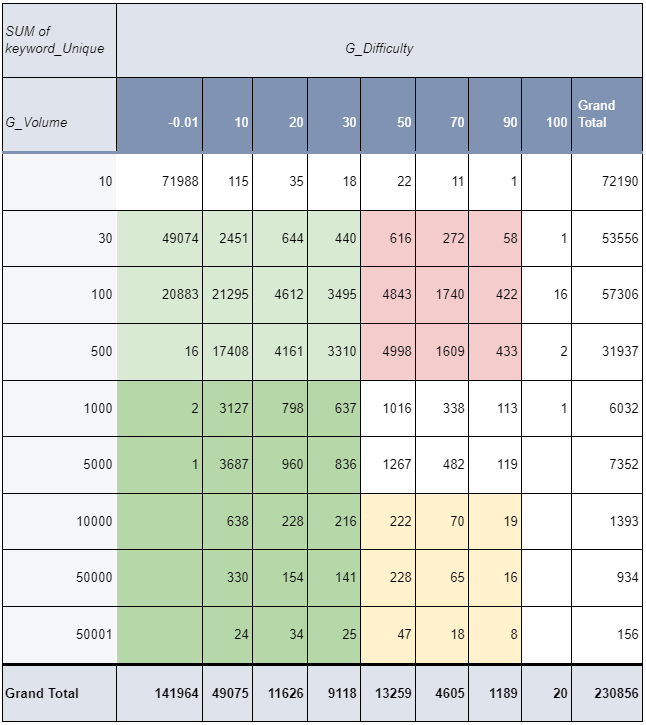
The picture is also quite optimistic, if you look at the number of unique keywords. Here’s the data on the distribution of the number of keywords by volume and promotion difficulty:

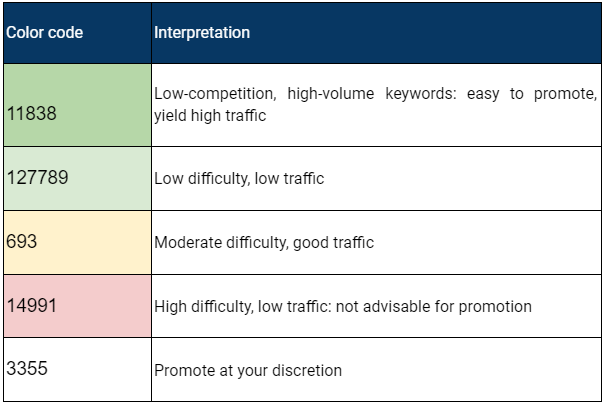
For convenience, we colored the cells according to the assessment of their promotion difficulty and the prospects for traffic gain. The numbers in the left column represent the total amount from the table above.

The most frequent of the researched keywords:
| Keyword | Volume | CPC | Difficulty |
| laptop | 844,000 | 0.35 | 58 |
| mobile phone | 844,000 | 0.06 | 75 |
| i phone | 570,000 | 0.10 | 58 |
| phone | 521,000 | 0.10 | 81 |
| jio phone | 423,000 | 0.06 | 19 |
| hp laptop | 393,000 | 0.15 | 15 |
| laptop price | 387,000 | 0.20 | 14 |
| headphones | 341,000 | 0.15 | 44 |
| boat headphones | 315,000 | 0.10 | 2 |
| boat earphones | 312,000 | 0.07 | 2 |
| best phone under 15000 | 291,000 | 0.10 | 18 |
| dell laptop | 276,000 | 0.15 | 24 |
| bluetooth headphones | 255,000 | 0.10 | 31 |
| headphone | 252,000 | 0.09 | 39 |
| jio store near me | 233,000 | 0.35 | 0 |
| lenovo laptop | 228,000 | 0.10 | 23 |
| vivo phone | 220,000 | 0.06 | 54 |
| mi phone | 209,000 | 0.10 | 27 |
| best phone under 10000 | 172,000 | 0.10 | 22 |
| oppo phone | 170,000 | 0.07 | 45 |
Keywords with the best Volume to KD ratio:
| keyword | Volume | CPC | Difficulty |
| iphone 13 price in india | 433,000 | 15 | |
| jio phone | 423,000 | 0.06 | 19 |
| hp laptop | 393,000 | 0.15 | 15 |
| jio phone next | 388,000 | 28 | |
| laptop price | 387,000 | 0.20 | 14 |
| boat headphones | 315,000 | 0.10 | 2 |
| boat earphones | 312,000 | 0.07 | 2 |
| best phone under 15000 | 291,000 | 0.10 | 18 |
| dell laptop | 276,000 | 0.15 | 24 |
| lenovo laptop | 228,000 | 0.10 | 23 |
| mi phone | 209,000 | 0.10 | 27 |
| jio phone 3 | 189,000 | 6 | |
| best phone under 10000 | 172,000 | 0.10 | 22 |
| bluetooth earphone | 163,000 | 0.08 | 23 |
| asus laptop | 136,000 | 0.10 | 13 |
| apple laptop | 133,000 | 0.15 | 14 |
| bluetooth earphones | 133,000 | 0.15 | 27 |
| mobile phone under 10000 | 125,000 | 0.04 | 9 |
| croma near me | 124,000 | 0.15 | 14 |
| wireless earphones | 123,000 | 0.10 | 20 |
| hp laptop price | 119,000 | 0.35 | 14 |
| ps5 price in India | 118,000 | 0.15 | 12 |
General conclusions
1. The three most traffic-rich keyword groups are those with the volume of 50000+, in the range of 10000-50000, and in the range of 1000-5000. They account for 65% of all traffic in the niche we researched. The groups with the volume of 5000-10000 and 100-500 rank second and account for 22% in their traffic potential.
We recommended finding keywords primarily from these two groups and including them in the SEO strategy to promote the website.
2. KD analysis showed that the promotion of such queries requires attention to the website’s link profile. In order to successfully outrank your competitors, you need to get a noteworthy number of referral links.
In this study, we showcased an effective method to extract keyword lists and utilize them to enhance the overall eCommerce SEO strategy.
To sum up, these are some of the tactics you should implement to improve SEO rankings and visibility:
- Collect all possible keywords,
- Evaluate Volume and potential traffic,
- Pay attention to KD,
- Choose keywords with the best Volume to KD ratio.
Next, we will introduce you to the second study in our research: a detailed analysis of search results in the context of keywords, Volume/KD and DR. It will help you gain control of the factors affecting the distribution of websites in SERP, identify the gaps in your competitors’ SEO strategies, and improve your SEO practices.


